Shortcut: wd:WDQS/Result viewsWikidata:SPARQL query service/Wikidata Query Hjælp/Resultatvisninger

Denne sider skal hjælp dig forstå de forskellige muligheder for at vise resultat i SPARQL-spørgsmåltjenesten. Siden query example page indeholder mange gode eksempler, som du kan afprøve!
Efter at du har kørt en søgning, kan du på "visningsknappen" vælge, hvordan du vil have at resultaterne skal vises. Forskellige visningsmuligheder er tilgængelige afhængig af hvilke datatyper du har fået kaldt.
Tabel (standard)
Viser resultaterne som en tabel. Det er 'standardvisningen for at vise resultater og kan vise alle datatyper.
Will map every variable from the SPARQL select clause to a formatted table column.
-
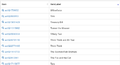 Table Result
 -
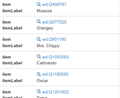 Table Result on small screens with flipped columns


Image Grid

Shows the result data as a grid with images.
Every grid item has a big picture and opens the gallery when clicking on it.
Contents an item is the formatted row data.
| Variabel | Datatype | Mapping | Beskrivelse |
|---|---|---|---|
| * | Commons Media | Grid Item | Image columns will create a grid item. |
Rows containing no image will be ignored.
It’s nonetheless possible to include no image rows in the result by modifying the sparql by including a default image in case the image variable is not bound:
  optional {
    ?item wdt:P18 ?img_ .
  }
  bind (if(bound(?img_),
           ?img_,
           <http://commons.wikimedia.org/wiki/Special:FilePath/File:Profile_avatar_placeholder_large.png>) as ?image) # [[:commons:File:Profile_avatar_placeholder_large.png]] as a placeholder
Here the file commons:File:Profile avatar placeholder large.png is used as a placeholder, you can use your own
Options
| Option name | Type | Beskrivelse |
|---|---|---|
hide
|
One or more variable names (strings, starting with ?), single value or array
|
Vis ikke disse variabler i resultatet. |
Kort
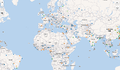
Shows the result data as map with OpenStreetMap data.
| Variabel | Datatype | Mapping | Beskrivelse |
|---|---|---|---|
| * | Koordinat | Map Marker | Columns will create a marker on the map.
Content of that marker is the formatted row data. |
| ?layer | Map Marker Layer | Creates a colored map layer that allows filtering. | |
| ?rgb | Farve | Color Map Marker | Example 000000 for black color. |
-
-
 Kort over lufthavne i Belgien Try Out


Technically, any well-known text literal can be displayed, not just a point coordinate.
Non-point geometry values are never stored on Wikidata, but they can be constructed in SPARQL using functions like CONCAT() and STRDT() –
see this map of Czech railway lines for an example of LINESTRING() geometry.
Options
specify using e.g. #defaultView:Map{"hide":["?foo", "?bar"],"layer":"?bar"}, using an array when there are multiple variables.
| Option name | Type | Beskrivelse |
|---|---|---|
hide
|
One or more variable names (strings, starting with ?), single value or array
|
Don’t show these variables in the result. |
layer
|
One or more variable names (strings, starting with ?), single value or array
|
Use these variables for the map layer, instead of the default ?layerLabel, ?layer.
|
markercluster
|
boolean or object |
|
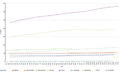
Line, Bar, Scatter and Area Chart
Shows one of these chart types.
| Variabel | Datatype | Mapping | Beskrivelse |
|---|---|---|---|
| * | Nummer
Etiket DateTime |
X-akse
Y-akse |
First will be X-axis, second Y-axis |
| * | Label | Category / Legend Item (optional) | Will only be used after the above are mapped |
| * | Label | Storyboard / Animation (optional) | Will only be used after the above are mapped |
-
-

-
-
 Spredningdiagram (animeret) Test det


Boblediagram

Viser et boblediagram, hvor størrelsen og farven på boblerne kan konfigureres.
Når et objekt er tilgængeligt, linkes en boble til Wikidata.org
| Variabel | Datatype | Kortlægning |
|---|---|---|
| * | Etiket | Boble-etiket |
| * | Nummer | Boblestørrelse |
| * | Objekt | Boblelink (valgfri) |
| ?rgb | Farve | Boblefarve (valgfrit) |
Tree Map

Shows a zoomable tree map.
| Variabel | Datatype | Mapping | Beskrivelse |
|---|---|---|---|
| * | Etiket | Etiket | 1st label in a row will be 1st level in tree map. 2nd label will be 2nd level. 3rd label will be 3rd level etc.. |
| * | Item | Link (optional) | |
| * | Quantity | Size |
Træ
Shows an expandable tree.

| Variabel | Datatype | Mapping | Beskrivelse |
|---|---|---|---|
| * | Item | Node ID | First item will be a root node the following items in the same row will be nested. |
| * | Etiket | Node Label (optional) | Labels will be appended to current node. |
| * | Nummer | Node Label (optional) | |
| * | Commons Media | Item image |
Tidslinje

Viser en tidslinje, der kan udforskes.
| Variabel | Datatype | Kortlægning | Beskrivelse |
|---|---|---|---|
| * | DateTime | Item Point in Time
Item End Point in Time |
First date in a row sets the item position in the timeline.
If a second date is present a start and end date will be set. |
| * | Commons Media | Item image |
Options
| Option name | Type | Beskrivelse |
|---|---|---|
hide
|
One or more variable names (strings, starting with ?), single value or array
|
Don’t show these variables in the result. |
Dimensioner

Shows dimension and their links.
It also allows filtering them by selecting an axis fraction.
This type of graph is also known as parallel coordinates.
| Variabel | Datatype | Mapping | Beskrivelse |
|---|---|---|---|
| * | Etiket | Dimension | Every column in the result row is mapped to a dimension |
| * | Nummer | ||
| * | DateTime |
Graf
Shows an interactive graph that allow hierarchically ordering and exploring items.
| Variabel | Datatype | Mapping | Beskrivelse |
|---|---|---|---|
| * | Item | Node ID | First item in a row of output variables will have an arrow pointing to the items in the same row. |
| * | Label | Node Label (optional) | |
| * | Commons Media | Node Image (optional) | |
| ?rgb | Farve | Node Color (optional) | For eksempel 000000 for sort farve. |
| * | Nummer | Node Size (optional) | |
| ?edgeLabel | Etiket | Edge Label (optional) |

Additional Information
RDF Data Type Mapping
| RDF Type | RDF Data Type | Constraint | Datatype |
|---|---|---|---|
| URI | Streng starter med http://www.wikidata.org/entity/Q |
Entity | |
| URI | Streng starter med http://commons.wikimedia.org/wiki/Special:FilePath |
Commons Media | |
| Literal | http://www.w3.org/2001/XMLSchema#dateTime | DateTime | |
| Literal | http://www.opengis.net/ont/geosparql#wktLiteral | Coordinate | |
| Literal | http://www.w3.org/2001/XMLSchema#double
http://www.w3.org/2001/XMLSchema#float http://www.w3.org/2001/XMLSchema#decimal http://www.w3.org/2001/XMLSchema#integer http://www.w3.org/2001/XMLSchema#long http://www.w3.org/2001/XMLSchema#int http://www.w3.org/2001/XMLSchema#short http://www.w3.org/2001/XMLSchema#nonNegativeInteger http://www.w3.org/2001/XMLSchema#positiveInteger http://www.w3.org/2001/XMLSchema#unsignedLong http://www.w3.org/2001/XMLSchema#unsignedInt http://www.w3.org/2001/XMLSchema#unsignedShort http://www.w3.org/2001/XMLSchema#nonPositiveInteger http://www.w3.org/2001/XMLSchema#negativeInteger |
Nummer | |
| Literal | Has no RDF Data Type | Label | |
| Literal | Har egenskab xml:lang |
Label | |
| Literal | String matches /^[0-9A-F]{6}$/ |
Farve |
Formatting
There is special formatting for the following data types:
| Datatype | Format |
|---|---|
| Entity | Link to Wikidata.org
Label is shortened to wd:Qxx Explore an item (magnify icon) |
| DateTime | MM DD, YYYY
Tooltip shows raw ISO timestamp |
| Commons Media | Link to Commons.Wikimedia.org
Displaying Gallery ( image icon ) |
Mobile / Responsive
Result views are made to work on different devices and resolutions. Their appearance may change depending on the space they can use.
Embed Mode
Result views can be linked or embedded via iframes. You can get the regarding link or code by clicking Link in the above menu.
Se forskellen: link to a query og link to a result or the embed code:
<iframe style="width:80vw; height:50vh;" scrolling="yes" frameborder="0" src="http://tinyurl.com/zwf4k2w">
Download results

There are several ways to export the results of a query.
JSON, TSV and CSV are three different open-standard formats to download the data, offered under the Download tab. To get results in XML format, click on Link > SPARQL endpoint.
You can also download some of the graphic views as a SVG file: this feature works with all the views except table, image grid, timeline, graph builder, map, and graph.
Default View
The default view can be change for each SPARQL query by using a comment:
#defaultView:[NAME]
For eksempel:
#defaultView:ImageGrid
Result view options
Result views can be configured with various options, which are specified in JSON (Q2063) format,
either following the defaultView comment (see previous section)
or following a separate view comment.
#defaultView:Map{"layer": "?typeLabel"}
#view:ImageGrid{"hide": "?coords"}
Title
Result views can show a title. The title can be set via a title comment.
#title:A title of your choice
Auto language
When using the magic keyword [AUTO_LANGUAGE] it is replaced by the users language when submitting the query. This allows writing a query with where the result is displayed in the users language.
Eksempel:
#<span lang="en" dir="ltr" class="mw-content-ltr">Use language of the user for display labels and fallback to english as default</span>
SERVICE wikibase:label {
    bd:serviceParam wikibase:language "[AUTO_LANGUAGE],en" .
}
Auto coordinates
When using the magic keyword [AUTO_COORDINATES] it is replaced by the users location when submitting the query. This allows writing a query with the users' location.
Eksempel:
  SERVICE wikibase:around {
    ?place wdt:P625 ?coordinate_location.
    bd:serviceParam wikibase:center "[AUTO_COORDINATES]".
    bd:serviceParam wikibase:radius "1".
    bd:serviceParam wikibase:distance ?dist.
  }